Are You Prepared to Take Control of Your Future?
Learn Minor Things That No Body’s Gonna Tell You.

Learn Minor Things That No Body’s Gonna Tell You.
Candlestick patterns are among the most powerful tools used by traders to analyze price movements in financial markets. Whether you are trading stocks, forex, or cryptocurrencies, understanding different candlestick types can significantly improve your market predictions.
The purpose of this blog is to help you with your trading journey in an educational way. Where you get to understand the basics of trading with examples of my own life story.
In this guide, we will explore the various types of candlesticks, their significance, and how they can help you make informed trading decisions.
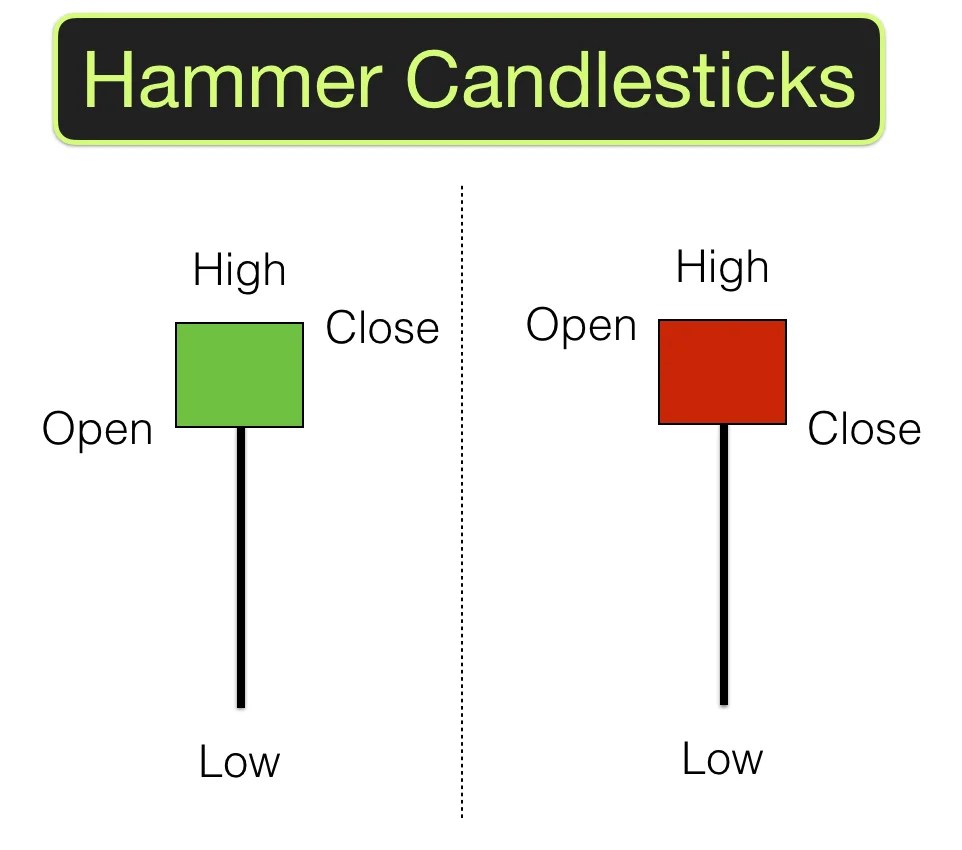
Candlestick patterns are graphical representations of price movements over a specific period. They consist of four key components:
Each candlestick tells a story about market sentiment, helping traders gauge whether buyers or sellers are in control.
Candlestick patterns can be broadly classified into bullish, bearish, and neutral patterns. Let’s explore each category in detail.
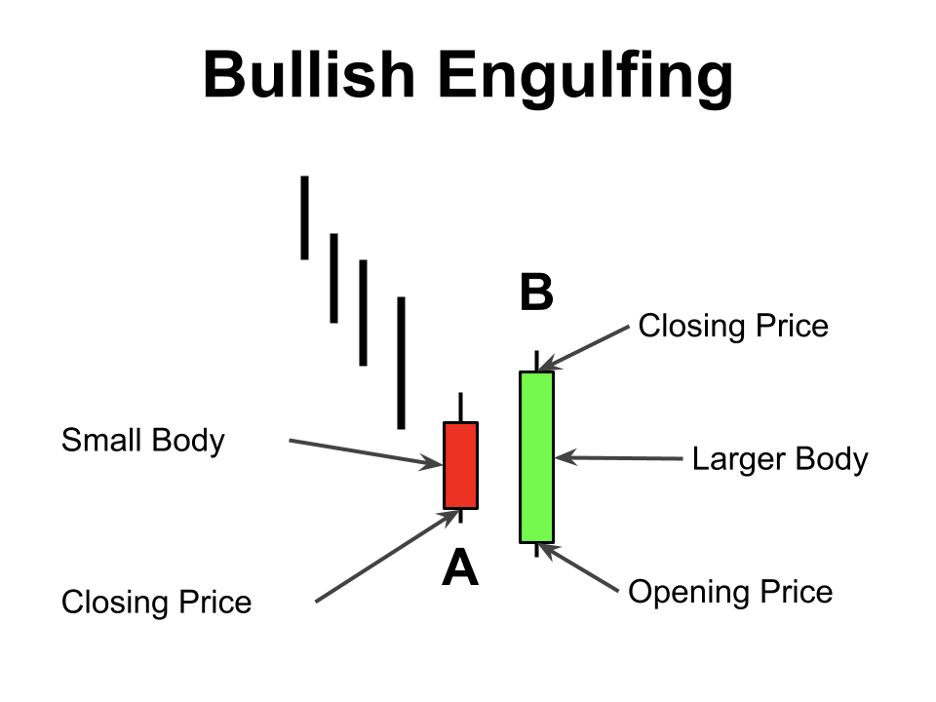
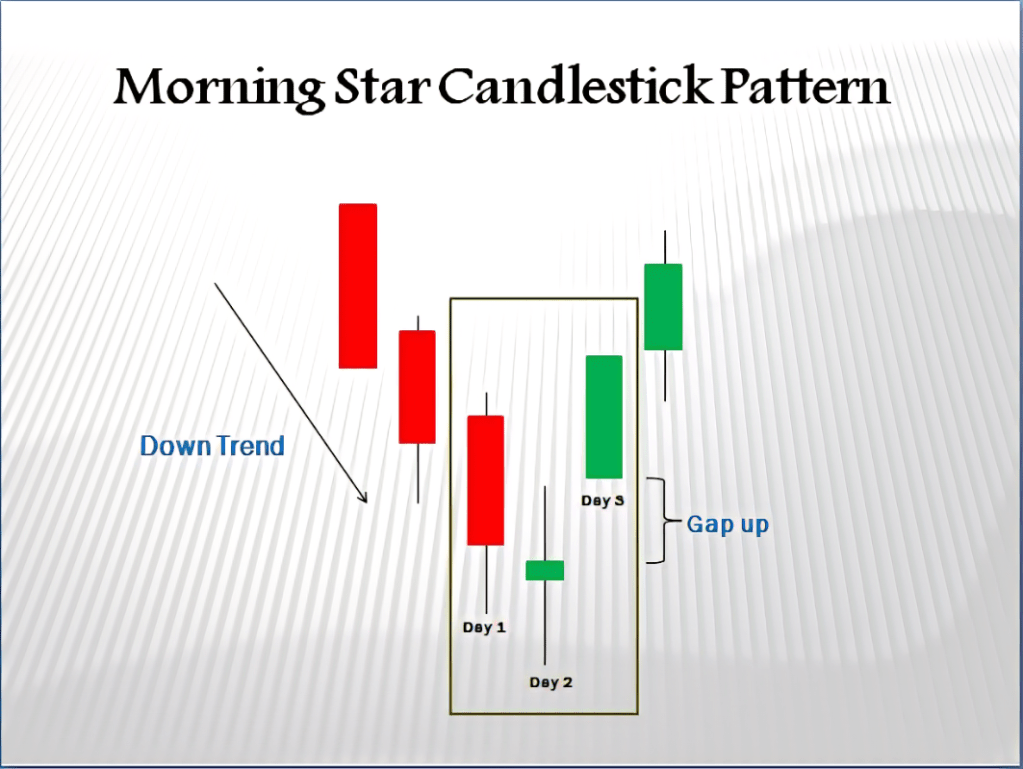
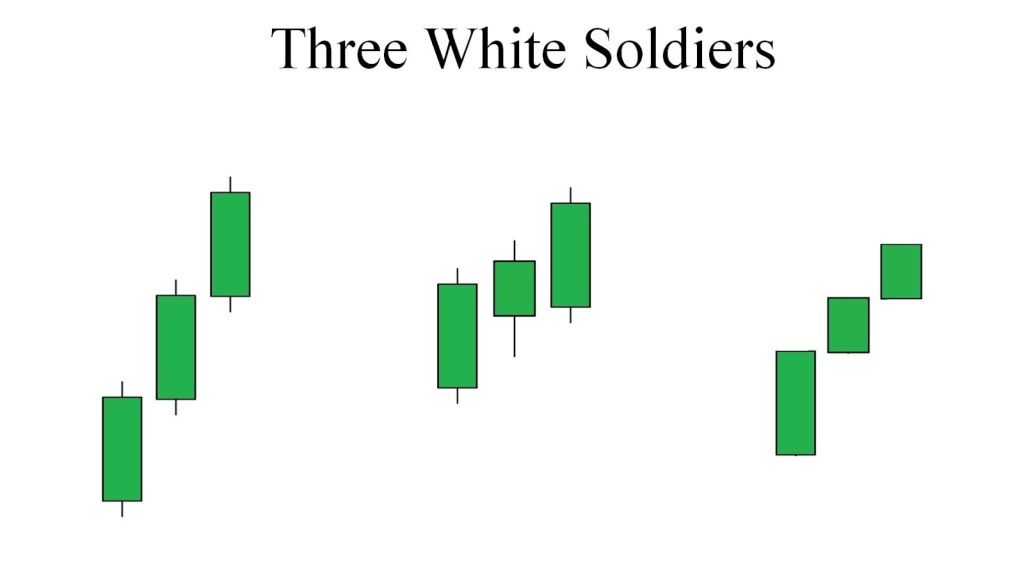
Bullish candlestick patterns signal a potential price increase. These patterns indicate that buyers are gaining momentum and pushing the market higher.
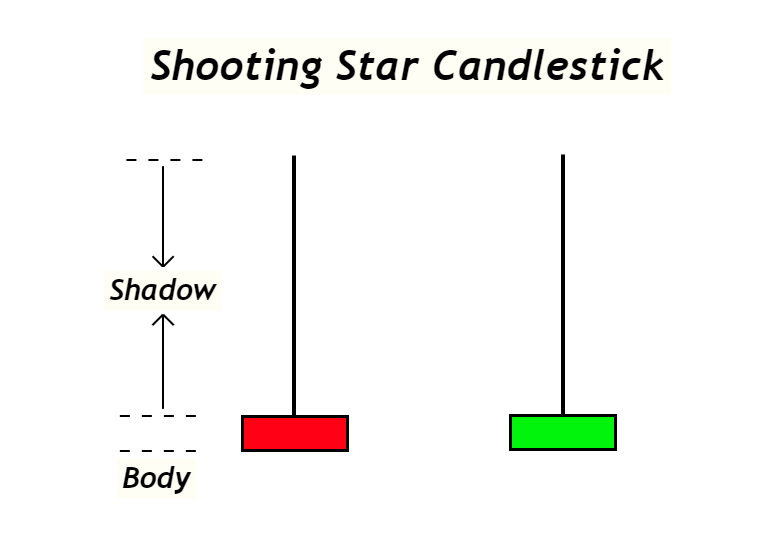
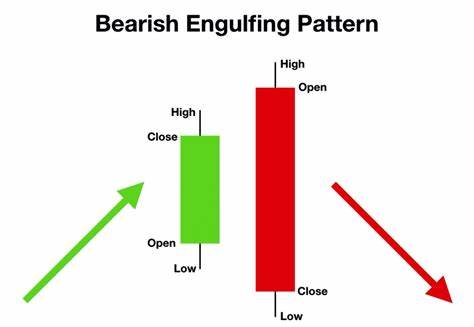
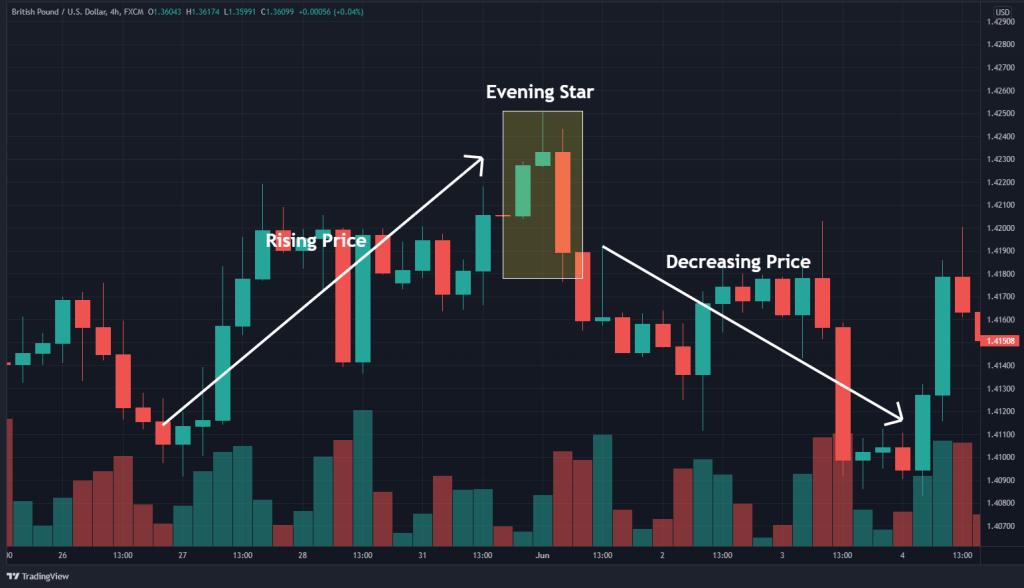
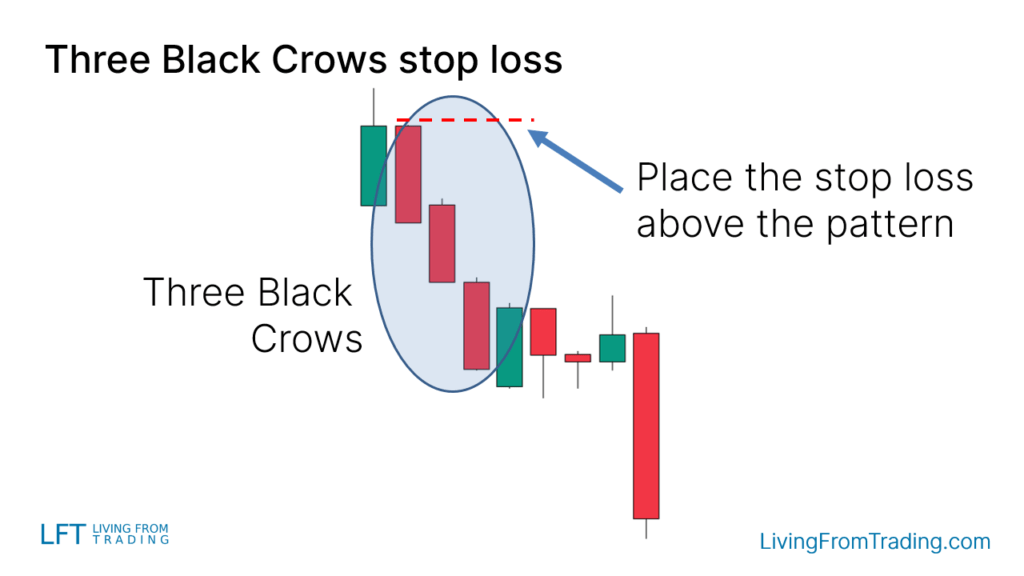
Bearish candlestick patterns suggest a potential price decline, signaling that sellers are in control.
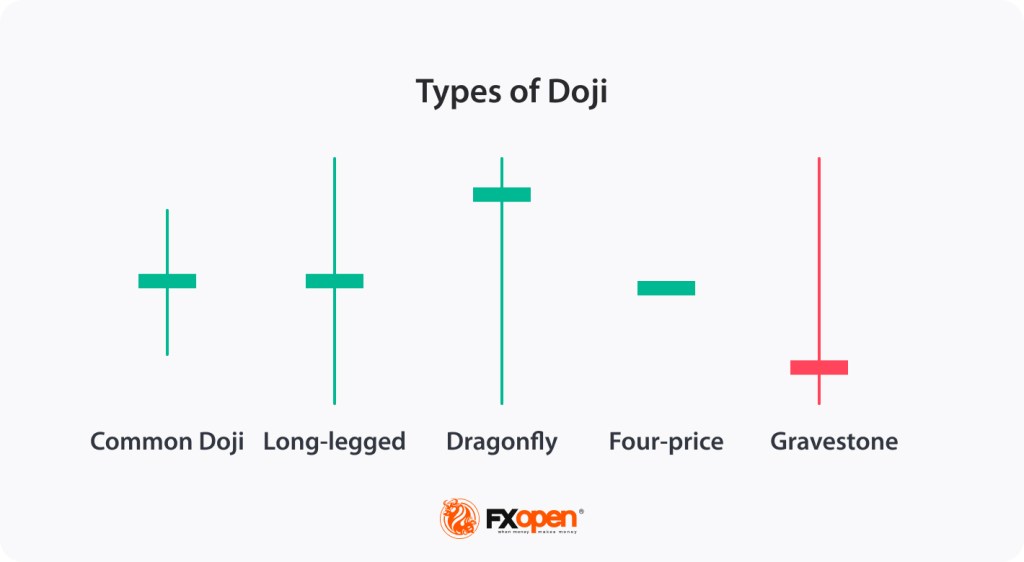
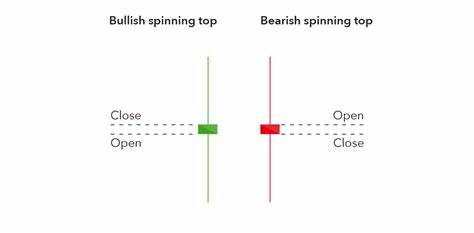
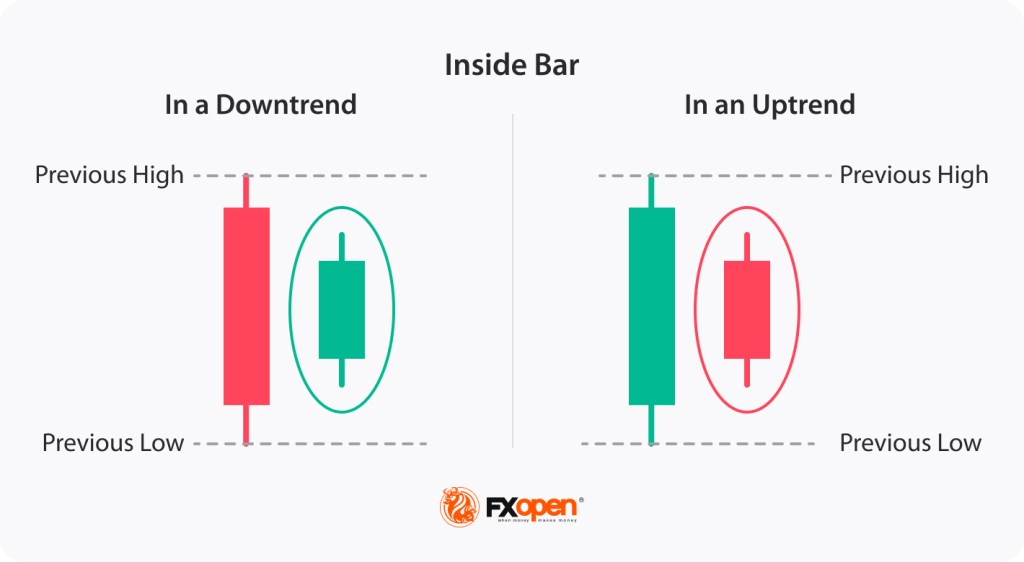
Neutral candlestick patterns indicate market indecision. These patterns do not provide a clear direction but often precede strong price movements.
Understanding candlestick patterns provides traders with valuable insights into market trends and potential reversals. Here’s why they are essential:
Candlestick patterns help traders determine whether a market is in an uptrend, downtrend, or consolidation phase.
Recognizing bullish and bearish patterns enables traders to enter and exit trades at optimal points, maximizing profits and minimizing risks.
Traders often use candlestick patterns alongside other technical indicators like Moving Averages, RSI (Relative Strength Index), and MACD (Moving Average Convergence Divergence) for better accuracy.
By identifying potential reversals, candlestick patterns help traders set stop-loss orders effectively, protecting their capital from major losses.
Experienced traders incorporate candlestick analysis into their strategies to improve decision-making and increase the probability of successful trades.
Mastering candlestick patterns can significantly improve your trading performance. By understanding bullish, bearish, and neutral candlestick formations, you can make more informed decisions and enhance your trading strategy.
Start observing these patterns in real-time charts, practice identifying them, and use them alongside technical indicators for better accuracy. Over time, you’ll develop a keen eye for market trends and price movements, giving you an edge in trading.
Do you use candlestick patterns in your trading strategy? Share your thoughts in the comments below!

Leave a comment